Plot Digitizer Web App
Oct 2022
Introduction
Have you ever needed to convert data from a graphical format and found yourself painstakingly entering data in a spreadsheet while zooming in and out on the plot image?
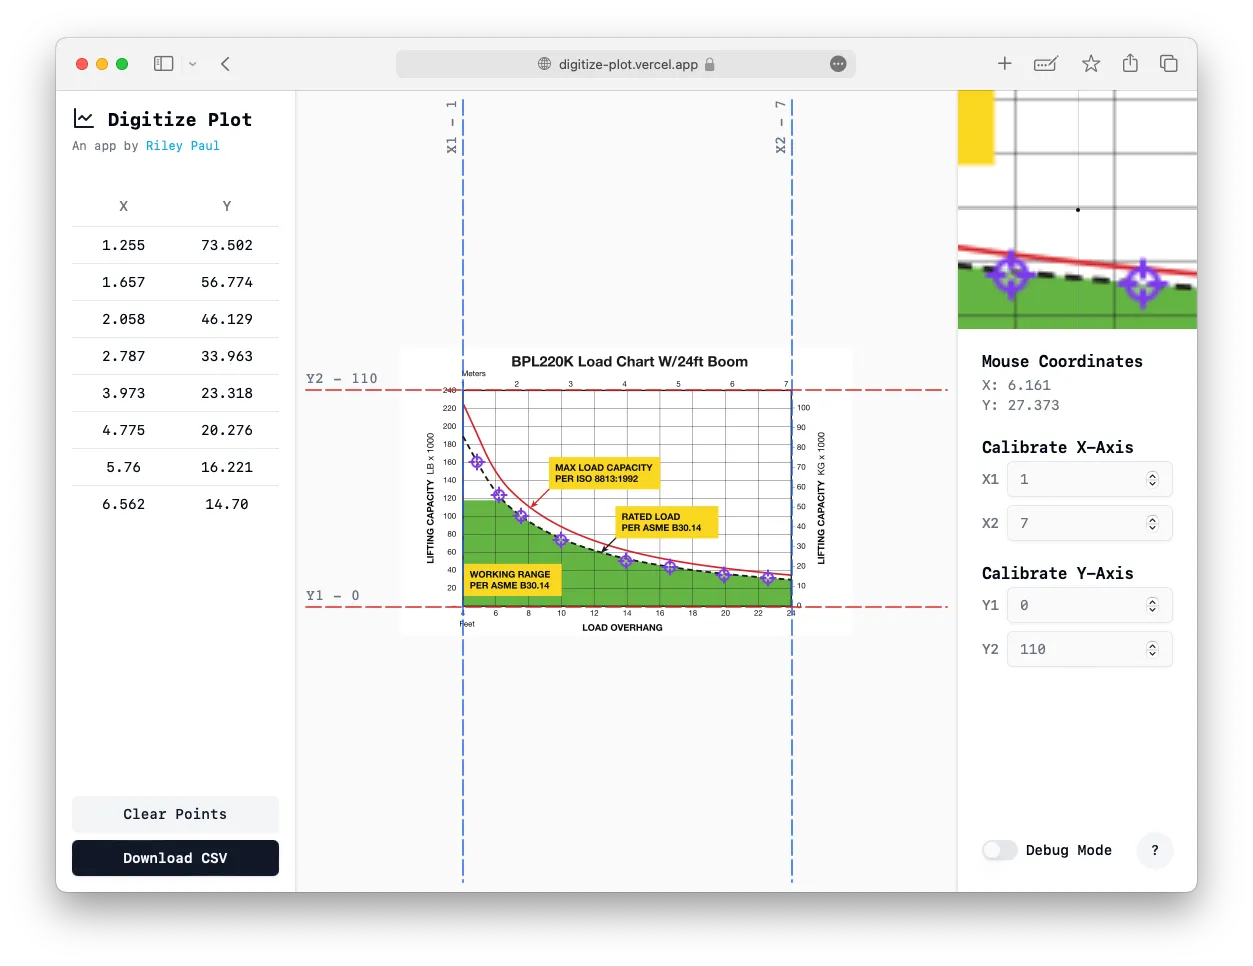
This web app allows users to upload an image of a plot, calibrate an x and y scale, drop as many points as they would like on it, then export those points to CSV with accurate coordinates.
How it Works
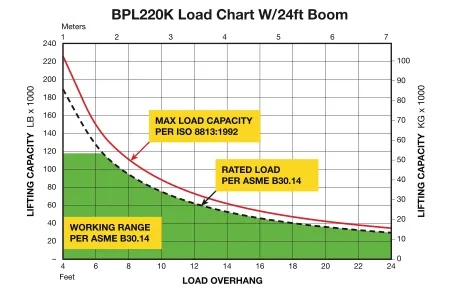
There are many instances where data is available in only a chart format with an x and y axis and minimal labels. The below is a prime example of this.
This app allows users to import an image, calibrate the image, then place as many points as they would like and export those to a CSV file. Currently the tool is only able to be calibrated for linear plots.
How I Built It
This single-page React application is written in Typescript and hosted on GitHub Pages. I tried to use as few libraries as possible and work directly with native web technologies such as canvas and form elements.
I used the Shadcn UI component library to enhance the overall fit and finish.
I implemented my own version of the Quadtree Optimization algorithm to efficiently determine which point the cursor is hovering over in the canvas.
Future Plans
In the future I would consider adding options for different axis scales such as logarithmic and datetime.